31 Jul Statistical Analysis of the MathMoms Interns’ Impact
Statistical Analysis of MathMoms Interns Impact on Gr 2 Group of an Elsies River School
There are 110 children in the Gr 2 group at the school, of those, 26 children were selected for mentorship by the MathMoms. It should be noted that MathMoms were not active for most of the first term and began their activities in late April at the school. The results measured were those of the Afrikaans home language marks.
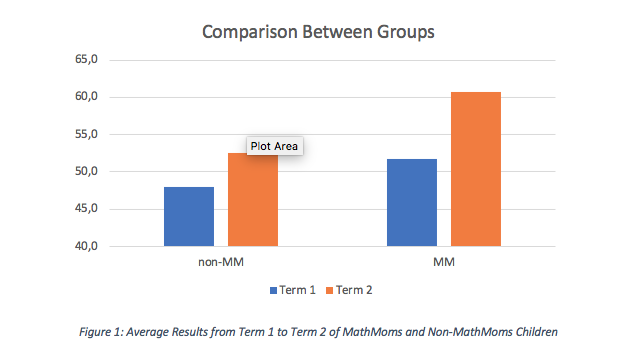
Naïve statistical analysis between the two groups of children showed greater increase in relative improvement from term 1 to term 2 of the MathMoms Interns children when compared to children who did not receive mentorship. Those in the MathMoms Intern group finished their first term with an average of 51.7% in overall marks, and their second with an average of 60.7%. This is the result of an average relative improvement in student marks of 17.6% (relative improvement being the fraction increase in marks compared to the first term, not the absolute percentage improvement).
In comparison, those not in the MathMoms Intern group ended their first term with an average mark of 48.0% and their second at 52.6%, a relative improvement of 13.5%. These findings are summarised in Figure 1 below.
Figure 1: Average Results from Term 1 to Term 2 of MathMoms and Non-MathMoms Children
To assess if there is statistically significant improvement in results, a more in-depth analysis of variance must be performed. This test compares the means (or averages) of the results from each term and groups and checks to see if they are statistically different. The differences are considered statistically significant if the probability of them being different is at least 95%.
The results of the one-way analysis of variance of the data for each group are summarised in Figure 2. These figures are known as box plots and can be interpreted as follows: the red bars are the means for each group, with the upper and lower edges of the blue box being the 75th and 25th percentiles respectively for the group results. The black whiskers which extend out indicate the extremes of the data which are not considered outliers. Lastly the notches in the boxes in indicate the range of the mean intervals.
If the notches of two boxes do not overlap, then their means are statistically different, though the statistical difference will be evaluated in the next test with multiple comparisons.
Starting with the students who were not tutored by the MathMoms Intern, it is shown that while there is an increase in the average marks, the marks 25th percentile are not similarly improved. There is good improvement in the 75th percentile, and some improvement in worst and best marks from term 1 to term 2.
 Figure 2: One-Way ANOVA of Students Results
Looking at the results for the MathMoms Interns Students, there is an increase in the 25th percentile marks and an even larger increase in the 75th percentile marks from term 1 to term 2. Additionally, while the lowest results remain mostly unchanged, there is also a large increase in the highest results of the group.
This appears to indicate that the students under tutelage of the MathMoms Interns improved their results from the first term to the second more than students who did not receive any attention from the MathMoms Interns.
In the second multiple comparison test, the means of all groups are directly compared to see if they are statistically different. As summarised in Figure 3, the average results of the students are only statistically different when comparing students who did not receive MathMoms Interns assistance in term 1 with students who did in term 2. However, there is more to take away from this test and the data behind the figure.
The statistical significance of the difference between first term results from students in the MathMoms Interns group and those not in it is only 24.3%, showing that the students selected for the MathMoms Interns training are not statistically unique from the rest of the class and are a good representation of it. Furthermore, if we compare improvement between the MathMoms Interns and non-MathMoms groups from term 1 to term 2, the confidence of the improvement being significant increases from 71.3% to 78.4%.
This shows that the MathMoms Interns are having a positive effect on the improvement of results from one term to the next.
 Figure 3: Multiple Comparison Test of Student Results
However, it should still be noted that the term 2 results are not statistically significant between MathMoms Interns and non-MathMoms students, though this is most likely due to the relatively low number of students currently being tutored by the MathMoms Interns.
It is likely that further results in line with these will give a definite statistical confirmation that the